


If you had $150 in 1980, you could buy a lot more than you can today. $150 in 1980 equals about $608 in 2026 dollars, based on changes in the U.S. Consumer Price Index.

You can use an inflation calculator to see how prices have changed across the United States. This comparison highlights why the cost of everyday goods sometimes rises faster or slower than the overall inflation rate.
Key Takeaways
- $150 in 1980 had buying power equal to about $608 in 2026.
- CPI tracks broad price changes over time.
- Prices for specific goods and services may have shifted by different amounts.
Today’s Equivalent Value and Buying Power
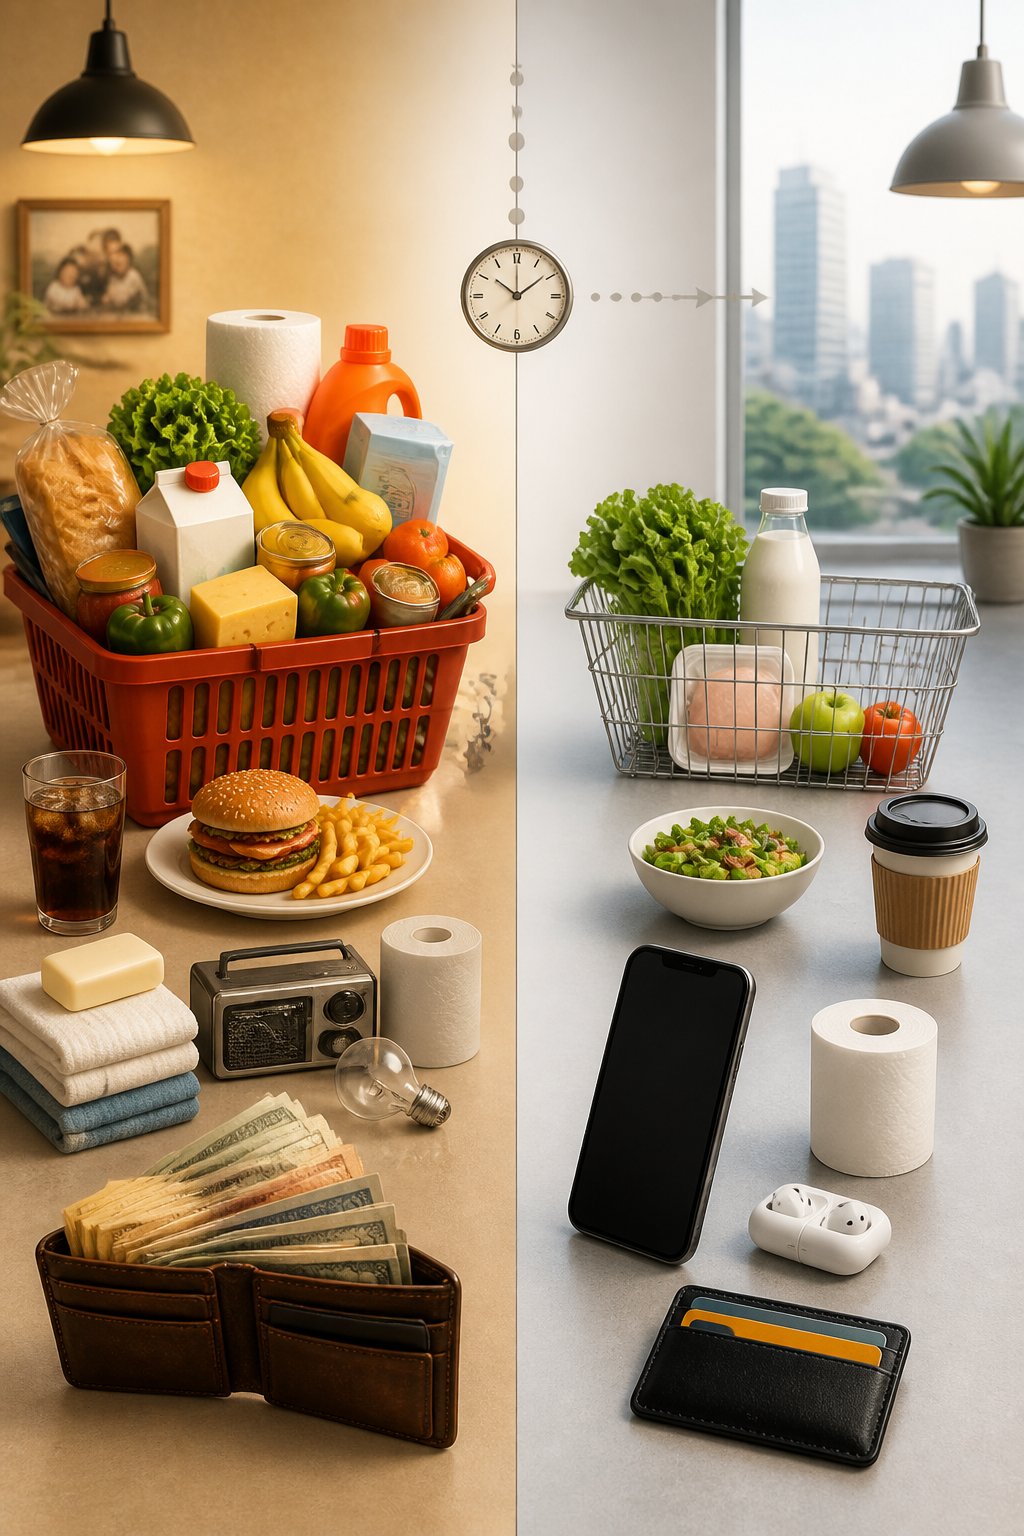
With the CPI estimate, $150 in 1980 equals about $607.92 in 2026. Prices have climbed a lot since 1980, so the same $150 just doesn’t stretch as far as it used to.
The Estimated 2026 Value of $150
If you had $150 in 1980, you’d need about $607.92 in 2026 to match its buying power. This comes from U.S. Consumer Price Index data, using a CPI of 82.4 for 1980 and 333.952 for 2026.
| Measure | Amount |
|---|---|
| Original amount | $150 |
| 2026 equivalent | $607.92 |
| Dollar increase | $457.92 |
| Cumulative price change | 305.28% |
| Average annual inflation rate | 3.09% |
So, prices are about 4.05 times higher than they were in 1980. Each 1980 dollar has about 24.7% of its former buying power in 2026. You can check the detailed 1980-to-2026 inflation calculation for $150 for more specifics.
What the Change Means for Purchasing Power
Your $150 in 1980 could cover expenses that would now require roughly $608. If something cost $150 back then, you’d need to pay about $607.92 in 2026 for the same thing, assuming prices tracked inflation.
Not every product increased by exactly the same amount. CPI is an average across many goods and services, but things like housing, groceries, energy, healthcare, and wages all follow their own paths. So, your personal inflation rate really depends on what you buy and where you live.
The U.S. dollar loses value gradually as prices rise over time. Even moderate inflation chips away at what your money can buy if it goes on for years.
Why Current-Year Estimates Can Differ
A 2026 estimate might change as more CPI data comes out. Sometimes, the 2026 figure uses partial data or compares with the previous year, not a full-year average.
Different calculators can give different results because they use various months, methods, rounding, or update schedules. If you compare January 1980 to January 2026, you might get a different answer than if you use annual averages.
For the most accurate comparison, stick to the same CPI method and match the months for both years. A U.S. inflation calculator based on CPI data lets you choose specific dates instead of just yearly numbers.
How CPI Converts 1980 Dollars to Current Dollars
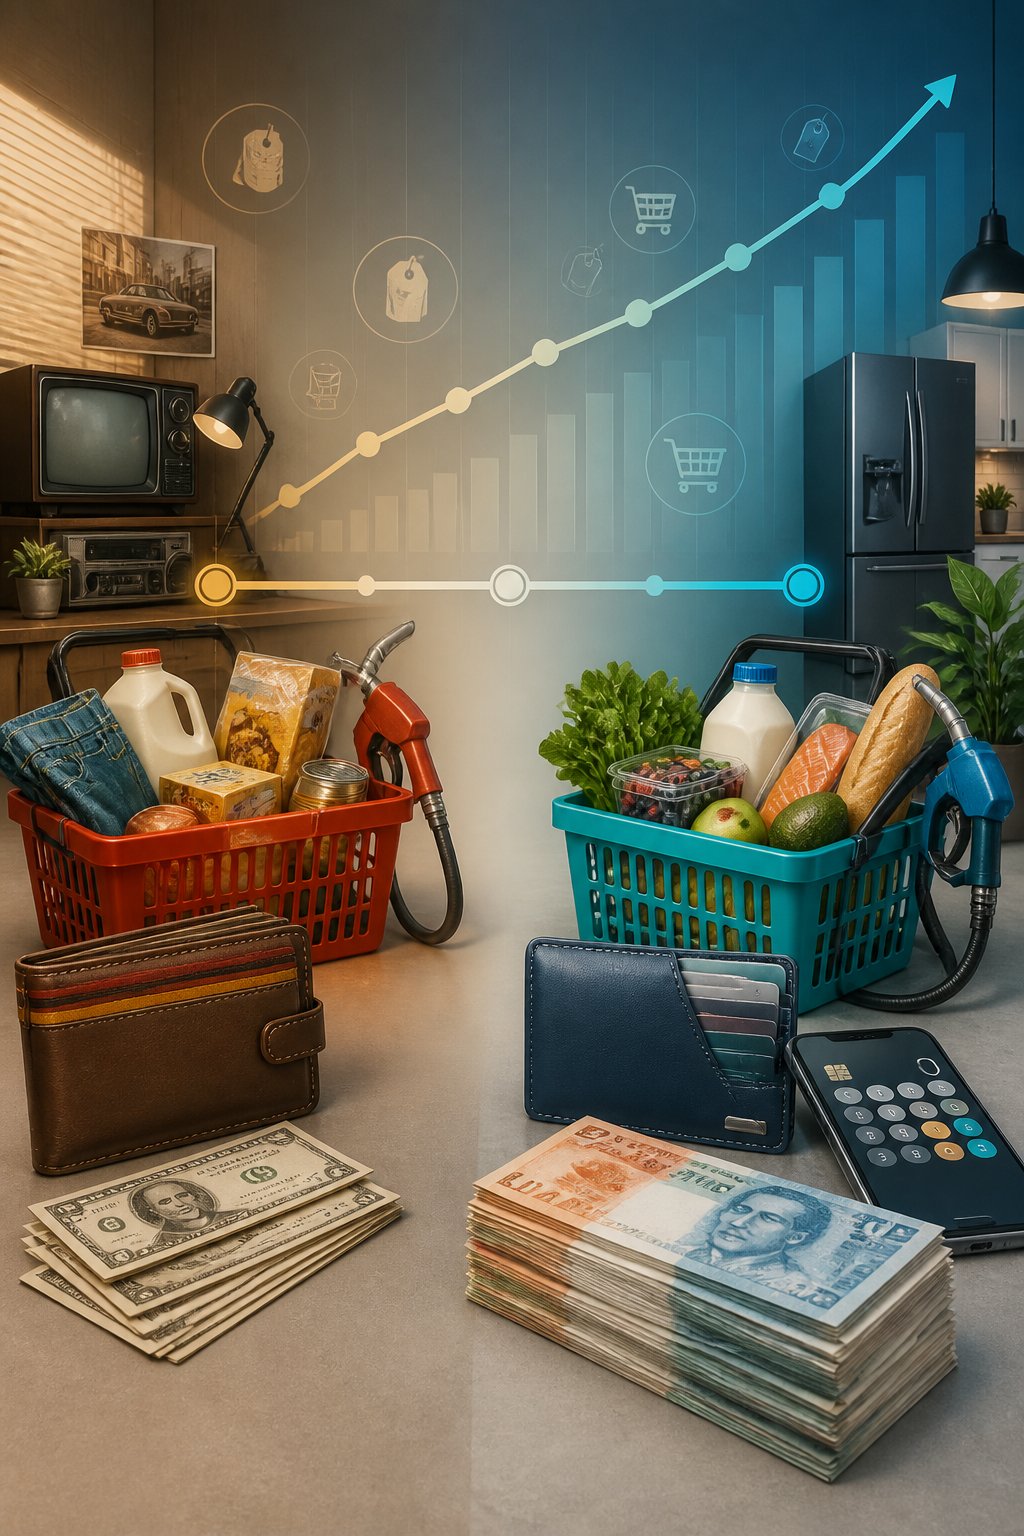
The Consumer Price Index (CPI) tracks how prices change over time for stuff urban households buy. To figure out what $150 in 1980 equals today, you use the CPI for the starting year and the CPI for the ending year.
The Inflation Adjustment Formula
Here’s the basic formula:
Current value = Original amount × (CPI in the to year ÷ CPI in the from year)
For $150 in 1980, you just multiply by the CPI ratio for 2026 and 1980. If the ratio is about 4.05, then $150 × 4.05 gets you roughly $607.50 in today’s dollars.
But not every item increased at the same rate. The CPI covers a big market basket, so prices for things like housing, food, and medical care can move in their own ways.
You can figure out the inflation rate like this:
Inflation rate = [(New CPI − Old CPI) ÷ Old CPI] × 100
CPI Values and Calculation Timing
The Bureau of Labor Statistics CPI calculator uses the CPI-U, which covers all urban consumers. It looks at prices for a wide range of goods and services.
Timing matters because the BLS puts out CPI data every month. If you use the 1980 annual average and a 2026 monthly index, you might get a slightly different result than if you use two annual averages. As new inflation data comes out, the numbers can shift a bit.
Most calculators show that prices in 2026 are about 4.05 times what they were in 1980. Treat that as an estimate based on the latest data. For really precise work, jot down the exact CPI numbers and dates you used.
Using an Inflation Calculator
To do the math yourself, just type 150 into the amount field, pick 1980 as your starting year, and pick 2026 or the latest year available as your ending year. The calculator does the rest.
The 1980-to-2026 dollar calculator uses historical CPI data to estimate the modern equivalent. You can also try another CPI inflation calculator to compare across years.
Check if the tool uses annual or monthly data, and pay attention to its last update. The result can shift when the BLS releases new CPI numbers.
Inflation Trends From 1980 Through 2026
Your $150 had a lot more purchasing power in 1980 than it does today. Inflation spiked at the start of the 1980s, and decades of price increases have really added up by 2026.
The High Inflation Rate of 1980
In 1980, inflation in the U.S. was especially high. The annual rate hit about 13.5%, according to the CPI. Prices rose way faster than usual that year.
If you bought something for $150 at the start of 1980, it might have cost about $170 by the start of 1981 if it followed the overall inflation rate. Inflation stayed high in 1981 and 1982 before it finally slowed down.
The Federal Reserve raised interest rates to cool things off and bring inflation down. That helped slow price increases, but prices didn’t drop back to where they were before. Once prices rise, even if inflation slows, they usually just keep growing—just not as quickly.
Yearly Inflation and Long-Term Compounding
Yearly inflation creates a compounding effect. Each year’s increase stacks on top of what’s already there, so even moderate inflation adds up over decades.
CPI data shows that $150 in 1980 equals roughly $608 to $634 in 2026, depending on the calculator and the exact data used. The Bureau of Labor Statistics CPI calculator is the official source for these numbers.
The difference in estimates comes down to timing and data updates. Some tools use annual averages, others use monthly numbers. For a practical ballpark, about $600 is a good estimate for what $150 from 1980 is worth in 2026 dollars.
Average Inflation Rate Versus Cumulative Change
The average inflation rate shows the typical yearly pace, but it’s not the same as the total price increase. From 1980 through 2026, the average annual rate is about 3.1% to 3.2%, and the cumulative price change is around 300%.
A 300% cumulative increase means prices are about four times higher. That doesn’t mean prices just rose by 300%—the original amount is included in the final price. So, $150 grows to about $600 or more when you look at purchasing power.
Use cumulative change to compare what your money could buy then and now. The average inflation rate helps you get a sense of the long-term yearly trend. Both numbers tell you something different about how prices move.
What a General Inflation Measure Does and Does Not Show
A general inflation measure looks at how money’s purchasing power changes across a big mix of goods and services. It helps compare $150 in 1980 with its value today, but your real experience depends on where you live, what you buy, and even how you invest.
Differences by City, Country, and Household Spending
Inflation isn’t the same everywhere. Housing, transportation, utilities, and local wages can all vary by city. Rent in New York City might change differently than rent in a small town. National CPI gives you an average, not a custom number for every household.
Inflation also varies between countries. Each one uses its own data, currency, and consumer basket. Comparing U.S. dollar purchasing power to another country’s inflation rate gets tricky unless you factor in exchange rates.
How you spend your money matters, too. If most of your budget goes to rent, healthcare, or college, your personal inflation rate might be way different from the national average. The BLS CPI calculator uses the U.S. CPI-U, which is based on urban consumers.
Food, Energy, and Other Everyday Price Changes
General inflation combines lots of categories, so it can hide big jumps in individual prices. Gas prices might spike and then drop, while electricity tends to rise more steadily. Food prices move unevenly—bread, eggs, and chicken don’t always follow the same trends because things like weather, feed, and transportation costs affect them.
You probably notice grocery inflation more because you buy food all the time. Energy prices hit your budget directly (gas, utilities) and indirectly (higher shipping and production costs).
CPI tracks a wide market basket, not just one item. The amount needed to match $150 from 1980 reflects average price changes, not the specific cost of groceries, gas, or electricity you’d buy.
CPI, Core Inflation, and PCE Price Index
The Consumer Price Index measures price changes for what urban households buy. It includes food and energy, so it’s useful for tracking your real-life costs but can be sensitive to short-term price swings.
Core CPI leaves out food and energy. Economists watch core inflation to see longer-lasting price trends, but cutting out food and energy doesn’t mean those aren’t important for your budget. You still have to pay for groceries, gas, and electricity.
The Personal Consumption Expenditures (PCE) price index tracks prices based on what people actually spend, using broader spending data than CPI. The Federal Reserve often looks at PCE inflation when thinking about price stability. CPI and PCE sometimes show different rates because they use different methods and baskets. The Federal Reserve Bank of Minneapolis inflation calculator explains more about how CPI-based comparisons work.
Inflation Adjustments for Savings and Investments
Inflation adjustments show how much more money you need just to keep up with rising prices. They don’t tell you if your savings or investments actually grew your wealth.
To figure out an investment’s real return, subtract the inflation rate from its approximate return. For example, if you earn 6% and inflation is 3%, your real return is about 3% before taxes and fees.
Compounding and the time period can change the exact result. It’s important to look at income taxes, fees, and capital gains tax, too.
A taxable investment can end up with a smaller after-tax return than it first appears. If your cash balance earns no interest, you lose purchasing power as prices go up, even if your account balance looks the same.
Frequently Asked Questions
Using 2026 estimates, you’d need about $596 to $634 today to match what $150 bought in 1980. The exact number depends on the CPI period and which calculator you use.
What would $150 from 1980 be worth in today’s dollars?
In 2026, $150 from 1980 would be about $634 after inflation, based on one CPI estimate. Other calculators put the number closer to $596, so it really depends on the data.
Back in 1980, $150 had about four times the buying power it does today. You can check the 2026 inflation estimate for $150 from 1980 for a specific calculation.
How much purchasing power has $150 from 1980 lost due to inflation?
If $150 in 1980 is worth $600 to $634 today, then the original $150 lost about 75% of its purchasing power. You’d need $600 now to buy what $150 did back then.
This change reflects how much consumer prices have gone up, not a drop in face value of the money itself.
What was the average inflation rate from 1980 to today?
From 1980 to 2026, the average annual inflation rate was about 3.18% in one estimate. This number comes from changes in the Consumer Price Index over the whole period.
Inflation didn’t move at the same pace every year. In 1980, the annual rate hit 13.50%, while recent estimates list it at 3.53%. You can see the 1980-to-2026 inflation calculation for the specific figures.
How does $150 in 1980 compare with $100 in 1980 today?
Both amounts changed by the same percentage as prices rose. Today, $150 from 1980 is about $600 to $634, and $100 from 1980 is about $400 to $423.
The $150 is still 50% more than $100 after adjusting for inflation, since the same multiplier applies to both.
What could $150 buy in 1980 compared with today?
In 1980, $150 went a lot further. You could buy several weeks of groceries, a clothing purchase, household goods, or part of a monthly bill, depending on where you lived.
Now, $150 doesn’t stretch as far. What it buys depends on the item, where you shop, taxes, and how product quality has changed. Inflation calculators look at average price changes, not the cost of one specific thing.
How is the current value of 1980 dollars calculated?
To figure out what money from 1980 is worth today, you multiply the 1980 amount by the ratio of today’s Consumer Price Index to the 1980 Consumer Price Index.
Current value = $150 × (current CPI ÷ 1980 CPI)
For example, if you use 76.7 for 1980 and 306.746 for 2024, you get a multiplier of about four. That puts $150 from 1980 at roughly $600 today.
You can see this in action with the CPI-based $150 calculation.